In this section I will walk through creating a simple SSIS package from scratch. As an example I will generate an Excel spreadsheet that can be used to manually enter a sales forecast by city and state. The city and state information will be extracted from the
AdventureWorksDW database and output to an Excel spreadsheet.
In the sections, we will walk through the following steps:
- Create a new SSIS package and discuss some of the package properties
- Add Connection Managers for our data source and destination
- Add tasks to the package Control Flow
- Add tasks to the package Data Flow
- Execute the package in BIDS
1. Creating a new SSIS Package
To begin, launch
BIDS by selecting
SQL Server Business Intelligence Development Studio from the Microsoft SQL Server 2008 program group. Click
File -->
New -->
Project on the top level menu to display the New Project dialog. Select
Business Intelligence Projects as the project type, then
Integration Services Project as the template; fill in the dialog as shown below:
After creating this new project and solution, you can navigate to the Sample folder in Windows Explorer and see the following:
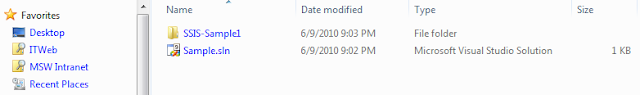
The Sample folder holds solution file (SSIS-Sample1.sln) and contains the SSIS-Sample1 folder which holds the Project. The Sample folder was created as a result of clicking Create directory for solution.
You will see the following in the Solution Explorer which is located in the top right corner of the window:
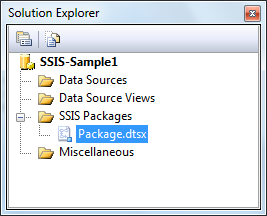
By default a new SSIS package is added when you create an Integration Services Project; you can right click on it and rename it.
To add a
new SSIS package, right click on the
SSIS Packages node under the
SSIS-Sample1 project and select
New SSIS Package from the popup menu. A new package
Package1.dtsx will be created. Rename this with
SalesForecastInput.
2. Connection Managers
This section is our second step in creating a simple SSIS package from scratch. SSIS packages typically interact with a variety of data sources. There is a
Connection Managers area on the design surface where you can specify each data source that you will access.
In this section we will add two data sources to our package - one to access the
AdventureWorksDW database and another to access our Excel spreadsheet.
To add the AdventureWorksDW connection manager, simply right click inside the Connection Managers area then choose New OLEDB Connection… from the popup menu. The Configure OLEDB Connection Manager wizard will be displayed; click the New button to display the Connection Manager dialog and fill it in as follows:
In my case the
AdventureWorksDW database is on my
local machine. Change the
Server name property as necessary for your environment. Click the
Test Connection button to make sure you can connect to the database. Click OK to complete this step.
To add a connection manager for our Excel spreadsheet, right click inside the Connection Managers area then choose New Connection from the popup menu, then select EXCEL from the Add SSIS Connection Manager dialog. The Excel Connection Manager dialog will be displayed; enter a file name as shown below:
We are now finished adding the necessary Connection Managers to our package.
3. SSIS Control Flow
This is our third step in creating a simple SSIS package from scratch. Control Flow contains the various tasks that the package will perform.
Add Data Flow Task
For our current package, we need a Data Flow task. Drag and drop the Data Flow Task from the Toolbox onto the Control Flow designer.
Right click inside the
Data Flow Task rectangle then select
Rename from the popup menu. Enter
Create Sales Forecast Input Spreadsheet as the new name for the task.
4. SSIS Data Flow
This is our fourth step in creating a simple SSIS package from scratch. Data Flow designer contains the various tasks that will be performed by a Data Flow task specified in the Control Flow.
To begin, click on the
Data Flow tab (or double click on Data Flow Task) in the designer and you should see the empty Data Flow designer.
Add Data Flow Task
For our current package we want to retrieve some data from the
AdventureWorksDW database and output it to an
Excel spreadsheet. To do this, we need an
OLE DB Source and an
Excel Destination. In addition, we need to add a column to the Data Flow; this column will be the numeric column in the spreadsheet where the user enters the forecast amount. Drag and drop an
OLE DB Source,
Derived Column, and
Excel Destination from the Toolbox onto the Data Flow designer. After doing so the Data Flow designer should look like this:
The red icons inside of the tasks are an indicator that there is some configuration required. Right click on the
OLE DB Source then select
Edit from the popup menu. This will open the
OLE DB Source Editor on the Connection Manager page. Select
SQL Command in Data access mode and write following query in SQL command:
SELECT
G.GeographyKey
,G.SalesTerritoryKey
,G.City
,G.StateProvinceName
AS [State]
,G.PostalCode
FROM dbo.DimGeography
AS G (
NOLOCK)
INNER JOIN dbo.DimSalesTerritory
AS T (
NOLOCK)
ON T.SalesTerritoryKey = G.SalesTerritoryKey
WHERE T.SalesTerritoryCountry =
'United States'
ORDER BY G.StateProvinceName,G.City
The SQL command text contains a simple query to retrieve the list of cities and states in the United States.
Click on Columns to display the column mappings as shown below:
By default all columns returned from the query are selected and the Output Column names are the same. The Output Column names can be edited. Click OK to complete the OLE DB Source Editor.
You will now see a green and a red line dangling from the OLE DB Source task on the Data Flow designer as shown below:
The green line is the normal data flow and the red line is the error flow. Drag the green line and connect it to the
Derived Column task. Notice that the red icon is now gone from the OLE DB Source task and it is now properly configured.
The
Derived Column task allows us to add a column to the Data Flow. Right click on it, select Edit, and then fill in the
Derived Column transformation Editor as shown below:
We have now added a new currency column to the data flow with a name of Forecast, and a value of 0. Click on the Derived Column task and drag the green arrow to connect to the Excel Destination task.
Right click the
Excel Destination task and select
Edit from the popup menu. The
Excel Destination Editor dialog will be displayed. Click the
New button next to the Name of the Excel Sheet to display the
Create Table dialog. The Create Table dialog allows us to create a new table in the Excel spreadsheet. The columns and their types are determined by the data flow. We configured an OLE DB Source task that executes a query and a Derived Column task that added the Forecast column to the data flow. You can edit the CREATE TABLE script if you like. Click OK on the Create Table dialog and the Excel Destination Editor Connection Manager page will look like this:
We configured the Excel Connection Manager in step two of this tutorial. Click on Mappings to display the Mappings page as shown below:
The above dialog sets the
Destination Column names to the
Input Column names by default.
At this point we have completed the Data Flow. Note that there are no longer any red icons in the task rectangles. We will proceed to the final step in this section of the tutorial and execute the package.
5. Executing a Package in BIDS
This is our fifth and final step in creating a simple SSIS package from scratch. Here we will execute the package within BIDS.
To begin, right click on the SSIS package
SalesForecastInput.dtsx and select
Execute Package from the popup menu.
While the package is running you will see each task turn green if it completes successfully or red if it fails.
Here is the Control Flow after the package has run successfully:
Here is the Data Flow after the package has run successfully:
We can see the execution result by click on Execution Results tab.
We can open the Excel spreadsheet that the package created and see the following (only a portion of the spreadsheet is shown):
The above spreadsheet shows the columns from our query plus the Forecast column which we added with the Derived Column task.
This completes our tutorial section on creating a simple SSIS package.


