

In this article, I will explain how to change the color of a chart dynamically. In other words, how to provide custom color palette feature at run time.
Lets start off with an example including step by step operations.
Step1. Open or create new Report Server Project. I am creating a new Report Server Project using SQL Server 2012 and saved it with LearnSSRS2012 name.
Step2. Add new Shared Data Source by right click on "Shared Data Sources" folder.


Step3. Now create a new report by clicking on Reports --> Add --> New Item --> Report --> Add. I don't like default report name like Report1, Report2, Report3 so I have renamed it to ChartColorCode.rdl.
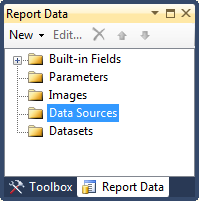
Step4. Create Data Source for ChartColorCode report. To create a new Data Source, right click on "Data Sources" followed by "Add Data Sources" under Report Data as shown below:
We will use Shared Data Source we created above. So click on "Use shared data source reference" and select Local data source created at step 2. Give any name to this report level data source. I will assign "Local" again. Click OK to proceed.

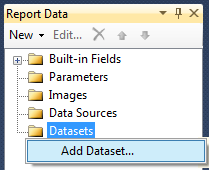
Step5. Now lets create couple of datasets. To create a new dataset, right click on "Datastes" followed by "Add Datastes" under Report Data as shown below:
I will use two data sources in this example, one for Color Palette and another for Chart.
To create new Dataset for ColorPalette, Right click on DataSets --> Add Dataset... and type "ColorPalette" in Name textbox. Select "Use a dataset embedded in my report" option and select Local as Data Source.

Select Text option in "Query Type" and type following query in Query window:
SELECT 'Red' AS ColorName UNION
SELECT 'DarkOrange' AS ColorName UNION
SELECT 'Green' AS ColorName UNION
SELECT 'Blue' AS ColorName UNION
SELECT 'Olive' AS ColorName UNION
SELECT 'SeaGreen' AS ColorName UNION
SELECT 'Brown' AS ColorName UNION
SELECT 'Gray' AS ColorName UNION
SELECT 'Tomato' AS ColorName
Click OK to proceed.
Create one more dataset using following query and name it Chart.ds:
SELECT 2010 AS [Year], 12000 Amount UNION
SELECT 2011 AS [Year], 15000 Amount UNION
SELECT 2012 AS [Year], 13000 Amount
Step6. Drag and drop "3D Cylinder" bar chart from toolbox. Drag and drop Amount field from Chart.ds to value field (Y axis) and Year field to Category Groups as shown below.

To make the chart more meaningful and dainty, do following formatting:
1. Replace Chart Title with "Year vs Amount".
2. Replace Y Axis Title with Amount.
3. Repalce X Axis Title with Year.
4. Remove the Chart Legend.
5. Change the font size and color as you wish.
6. Right click on the bar and select "Show Data Labels". Select Times New Roman in data labels font because numbers are better visible in this font.
After incorporating all the above changes, click on Preview tab to view the report. My report looks like one shown below:

Step7. Now I will explain how to change the chart color at run-time.
First of all, I will create a report parameter for dynamic color. Click on Parameters folders in Report Data and then click on Add Parameter... Define pColor as report parameter Name and Color as Prompt. Select parameter visibility Hidden. You can keep it as Visible if you wish to do so.

Click on Available Values under Report Parameter Properties window. Select "Get values from a query" option under "Select from one of the following options". Select ColorPalette in Dataset box, ColorName in "Value field", and ColorName in "Label field".
Click on Default Values under Report Parameter Properties window. Select "Get values from a query" option under "Select from one of the following options". Select ColorPalette in Dataset box, and ColorName in "Value field". Click OK to proceed.
Step8. Drag and drop Table control from toolbox.
Do set following properties for table control.
a) Table control will have three default columns. Delete one column.
b) Merge Table Header and write "Color Palette" in the textbox.
c) Write following expression in the second column of Table Details.
=IIF(Parameters!pColor.Value=Fields!ColorName.Value, "◄","")
and write following expression in background property of same text box:
=Fields!ColorName.Value
d) Select Table Details and then right click --> select "Row Group" --> select "Group properties"

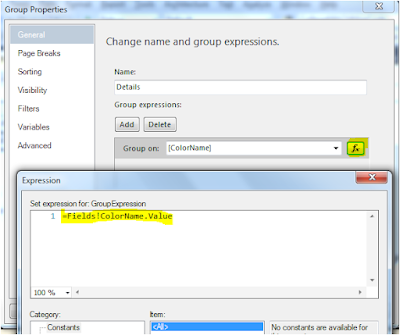
e) In "Group Properties" window, click on expression button under "Group on" box and write following expression =Fields!ColorName.Value.
f) Select first text box of Table Details and then right click to select "Test Box Properties" as highlighted below:

g) in "Text Box Properties" dialogue box, click on Action and select "Go to report" under "Enable as an action" and "ChartColorCode" in "Specify a report" box. Also select report parameter pColor in Name and [ColorName] in Value as shown below:

Step9. Now we are at the final step where we need to change the properties of bar chart to change the color at run time. Right click on bar chart and select "Series Properties".

In "Series Properties" window, click on Fill. and then click on expression button to open Expression window. Double click on pColor under parameter or write following expression manually as shown below:
=Parameters!pColor.Value

Step10. Its time to run the report and see the results.
First Preview:

Second Preview: Following report will be displayed once we click on Red color under:

Third Preview: Following report will be displayed once we click on DarkOrange color under:

I hope you like this article!
Lets start off with an example including step by step operations.
Step1. Open or create new Report Server Project. I am creating a new Report Server Project using SQL Server 2012 and saved it with LearnSSRS2012 name.
Step2. Add new Shared Data Source by right click on "Shared Data Sources" folder.
Now give any name to Share Data Source (Local, in my case) and click on Edit button to define Server Name and Database Name. In this example, I will use static data sources so I am using "." (you can also use "(local)") as ServerName. I am not defining any Database name so I will keep it blank (default will be msater). You can define any database, if you want. Now click on OK.

Step3. Now create a new report by clicking on Reports --> Add --> New Item --> Report --> Add. I don't like default report name like Report1, Report2, Report3 so I have renamed it to ChartColorCode.rdl.
Step4. Create Data Source for ChartColorCode report. To create a new Data Source, right click on "Data Sources" followed by "Add Data Sources" under Report Data as shown below:
We will use Shared Data Source we created above. So click on "Use shared data source reference" and select Local data source created at step 2. Give any name to this report level data source. I will assign "Local" again. Click OK to proceed.

Step5. Now lets create couple of datasets. To create a new dataset, right click on "Datastes" followed by "Add Datastes" under Report Data as shown below:
I will use two data sources in this example, one for Color Palette and another for Chart.
To create new Dataset for ColorPalette, Right click on DataSets --> Add Dataset... and type "ColorPalette" in Name textbox. Select "Use a dataset embedded in my report" option and select Local as Data Source.

Select Text option in "Query Type" and type following query in Query window:
SELECT 'Red' AS ColorName UNION
SELECT 'DarkOrange' AS ColorName UNION
SELECT 'Green' AS ColorName UNION
SELECT 'Blue' AS ColorName UNION
SELECT 'Olive' AS ColorName UNION
SELECT 'SeaGreen' AS ColorName UNION
SELECT 'Brown' AS ColorName UNION
SELECT 'Gray' AS ColorName UNION
SELECT 'Tomato' AS ColorName
Click OK to proceed.
Create one more dataset using following query and name it Chart.ds:
SELECT 2010 AS [Year], 12000 Amount UNION
SELECT 2011 AS [Year], 15000 Amount UNION
SELECT 2012 AS [Year], 13000 Amount
Step6. Drag and drop "3D Cylinder" bar chart from toolbox. Drag and drop Amount field from Chart.ds to value field (Y axis) and Year field to Category Groups as shown below.

To make the chart more meaningful and dainty, do following formatting:
1. Replace Chart Title with "Year vs Amount".
2. Replace Y Axis Title with Amount.
3. Repalce X Axis Title with Year.
4. Remove the Chart Legend.
5. Change the font size and color as you wish.
6. Right click on the bar and select "Show Data Labels". Select Times New Roman in data labels font because numbers are better visible in this font.
After incorporating all the above changes, click on Preview tab to view the report. My report looks like one shown below:

Step7. Now I will explain how to change the chart color at run-time.
First of all, I will create a report parameter for dynamic color. Click on Parameters folders in Report Data and then click on Add Parameter... Define pColor as report parameter Name and Color as Prompt. Select parameter visibility Hidden. You can keep it as Visible if you wish to do so.

Click on Available Values under Report Parameter Properties window. Select "Get values from a query" option under "Select from one of the following options". Select ColorPalette in Dataset box, ColorName in "Value field", and ColorName in "Label field".
Click on Default Values under Report Parameter Properties window. Select "Get values from a query" option under "Select from one of the following options". Select ColorPalette in Dataset box, and ColorName in "Value field". Click OK to proceed.
Step8. Drag and drop Table control from toolbox.
Do set following properties for table control.
a) Table control will have three default columns. Delete one column.
b) Merge Table Header and write "Color Palette" in the textbox.
c) Write following expression in the second column of Table Details.
=IIF(Parameters!pColor.Value=Fields!ColorName.Value, "◄","")
and write following expression in background property of same text box:
=Fields!ColorName.Value
d) Select Table Details and then right click --> select "Row Group" --> select "Group properties"

e) In "Group Properties" window, click on expression button under "Group on" box and write following expression =Fields!ColorName.Value.

f) Select first text box of Table Details and then right click to select "Test Box Properties" as highlighted below:
g) in "Text Box Properties" dialogue box, click on Action and select "Go to report" under "Enable as an action" and "ChartColorCode" in "Specify a report" box. Also select report parameter pColor in Name and [ColorName] in Value as shown below:

Step9. Now we are at the final step where we need to change the properties of bar chart to change the color at run time. Right click on bar chart and select "Series Properties".

In "Series Properties" window, click on Fill. and then click on expression button to open Expression window. Double click on pColor under parameter or write following expression manually as shown below:
=Parameters!pColor.Value

Step10. Its time to run the report and see the results.
First Preview:

Second Preview: Following report will be displayed once we click on Red color under:

Third Preview: Following report will be displayed once we click on DarkOrange color under:

I hope you like this article!


